The Difference between the Tax Levy and Taxes Levied and Why Wellstone was Right

24 Feb

The city budget negotiations this year sparked a public conversation about city finances and the details of budgeting. There was one piece missing, however, from the public conversation. It is the difference between the tax levy and the taxes levied. The former is the targeted budget set by the city. The latter is the method to reach that target. The difference between the two does make all the difference.

First, the levy. Each year the city sets a budget. The city decides how many new firefighters the city will hire and the number of bike lanes built. The city adds up all the services and infrastructure improvements to arrive at a grand total, the budget. The city then must raise the funds for that budget. Some of it comes from state and federal dollars and the largest share being from user fees (like garbage and recycling).  Another major source of funding is property taxes. That’s called the tax levy. It is the total amount of money set to be raised by the city through property taxes in a year. It is one big number; in 2014 it was $281.7 million. The tax levy does not tell us about how and from whom the funds will be raised. It is simply the total amount to be raised by taxing the value of all properties in Minneapolis. Ok, that’s the tax levy.

Next, the taxes levied. Once the budget is decided and the tax levy set (the total budget), taxes are levied. The taxes levied on an individual property do not rise at the same rate as the tax levy; this is true for a couple of reasons*. First, new properties can be built in the city which increases the value of the total property in the city. This in turn lowers the taxes levied on each building, new and old. The second reason, the relative value of individual properties can change within the city. The effect of each on taxes levied will be explored in turn.

The construction boom in 2014 can help explain the first case. Throughout the city thousands of buildings were built. New single family homes, office buildings and apartment towers were built, totaling $2 billion dollars in value. This is a 2.4% increase in value of property in the city from the year before.Property tax distribution 2015 
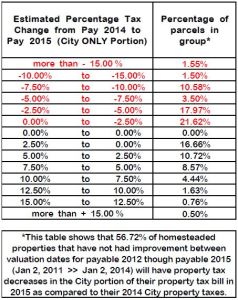
This means there is that much more total property value which can share the cost of the tax levy. It is part of why 56.7% of property owners who have not made improvements to their home will see a decrease in the taxes levied on their property. The same thing can also be explained with a couple bags of M&Ms.

Imagine you have 4 friends; 3 friends each have a one bag of M&Ms and the 4th with no bag. Your friend without a bag of candy could use some cheering up, so you each offer him 20 M&Ms, 5 each from you and your 3 friends. Along comes another friend, Felicia, who has a bag of candy too. She offers to also donate some M&Ms. Now with 5 friends, each person only needs to give 4 pieces. Sharing becomes easier with more friends.

Back to cities and not candy. When new buildings are built there is new value added to the city. This reduces the proportional contribution of property taxes by already existing properties. This means that when the whole city does better, we all do better.

Not all properties will see a reduction in taxes levied, however, because the amount of taxes levied also depends on the distribution of property values. Let’s return to the M&Ms. In the above example all the friends had the same sized bag of candy. Suppose instead one friend had a king sized bag as large as the other bags combined. That friend could have donated half the needed M&Ms. Property taxes are similar. The relative contribution of the value of a property to the city’s total also influences the taxes levied. Suppose the tax levy stays flat; from year to year the city needs to collect the same amount of money on properties in the city. A change in the relative value of a property will change the taxes levied on that property. If the value of a property grows slower than the city average, its relative value goes down and its taxes levied would go down. If the value of a property grows faster than the city average, its relative value goes up and its taxes levied would go up. This shows that sharing prosperity means we can share in the support of the city.

It is the interaction between these factors that show the wisdom of Wellstone’s old adage that “We all do better when we all do better”. We all live better when we expand opportunities so more neighbors can share our sidewalks. New neighbors and new homes spread the cost of the city to more people. We all live better when inequality is reduced because we can all contribute to the city we love. Our city does better when we all do better.

*There are many reasons, but these often only cover a small number of properties and are not part of the larger trends.

To have our carrots and eat them too

23 Nov

Those of us fortunate enough to live in Linden Hills live here because we love the small town feel of the neighborhood. We love having Wild Rumpus for the kids to find a book, we love having the Co-op close enough to walk and shop, and we love having Zumbro’s to take our families to on Mother’s Day.

It’s also clear many people are partial to a glass of wine on the benches at Tilia’s. The synergies from the density of businesses help each business grow. (If you give a kid a toy from Creative Kidstuff you might have to buy her a scoop of ice cream from Sebastian Joe’s.)

 The cluster of businesses exists, too, because of the synergies from the density of people. There are 2,217 single family homes in Linden Hills with an additional 1,061 multifamily units. These apartments, condos, and townhomes surround each of the business nodes providing additional neighbors and customers. Their density helps make the commercial nodes possible. We elected Betsy Hodges who called on Minneapolis to increase our population by 20 percent. We need increased density to improve the financial health of the city, to support efficient public transportation, and to grow our local food system.

If someone chooses to live on the fringe of the metro instead of Linden Hills, they are building on what was previously farmland. We love the local food at our farmers market, but those farmers will be pushed further afield without increased density in the city. Let’s support 20 percent more neighbors so we can have our carrots and eat them, too.

A Living Wage for Student Success

13 Apr

Minneapolis needs a living wage. Each year thousands of students graduate from Southwest, Washburn, Edison, and all the Minneapolis schools. Each year many of those students reach for their future and head to college. Some come from families fortunate enough to not need loans; most do not. As difficult as navigating the challenges of finding and attending college, it is even more difficult to navigate scholarships, student loan offices, and high interest rates. This difficulty is real. Minnesota students have some of the highest levels of student loan debt in the nation. Students are working 2 or 3 jobs to try to pay for their brighter future.

As kids we were told the stories of our parents or their peers working their way through college. We see them as role models and strive for success in the same way. The world is no longer the same. In 1980 the minimum wage was $3.10. In 1980 tuition at the University of Minnesota was $927. Working about 10 hours a week during the school year a student could earn enough money to pay for tuition*. This year’s tuition is $12,090. With the minimum wage bumped to $9.50 it would take a student 42 hours a week during the school year to pay for tuition. It is no wonder that student debt is piling up.

Raising the wage to $15 helps return into the realm of the possible the dream of working for a better education. At $15 an hour it would take a student 27 hours a week to pay for tuition; still a stretch, but possible. Declines in real wages and higher tuition costs have squeezed the Minnesota Miracle. It’s time to give families and students a raise. Won’t you support our students’ futures?

*The math used to calculate the weekly hours. $927/($3.10* 30 school weeks)= 10 hours a week. $12,090/(9.50*30 school weeks)= 42 hours a week. $1,090/($15* 30 school weeks) = 27 hours a week.

New Ulm: The Urbanists Utopia

24 Jan

Much of the political rhetoric about urbanism has become the MSP metro area vs. Greater Minnesota. This is a bad argument to make because in fact many of the small towns in Minnesota have better urbanism than many places within the metro. It is often from the Main streets of small towns that urbanists gain valuable insight. Today I am s profiling New Ulm to provide an example of an urban small town. Using the Longitudinal Origin-Destination Employment Statistics dataset from the Census Bureau I measured the employment and housing patterns within New Ulm.

With a population of 13,522 it features an intact main street, a college (Martin Luther), a brewery (Schells), a river, and downtown parks. Quite a list of an urbanist’s favorite things! Another impressive aspect of New Ulm is the larger number of people who both live and work within New Ulm.

H2W_NewUlm
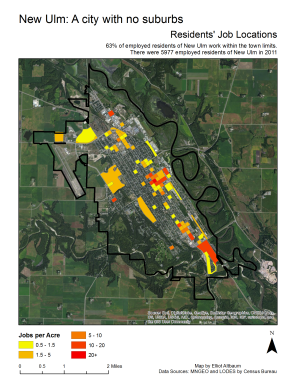
The first map shows the job locations of workers who reside within New Ulm. Some of the workers who reside in New Ulm work in one of the many other small towns surrounding it. However, 63% of the 6977 New Ulm workers work in New Ulm. For a town that is only a couple square miles it means a large majority of residents could walk or bike to work. The southern area that is red is a more industrial area. The area in the middle of the map is downtown. Educational and medical facilities are represented by the large orange census blocks on the west side of town.


This second map shows the home locations of all employees of jobs located within New Ulm. This map shows a reciprocal of sorts of the first map. Instead of job locations of workers, this map shows home locations of jobs located within the W2H_NewUlm
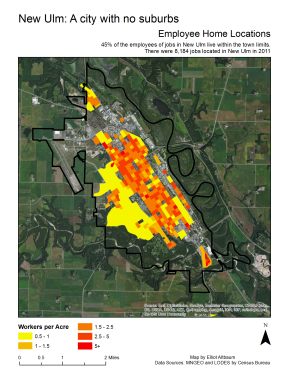
boundary of the town. As expected the areas outside of downtown are the major residential areas. 45% of the 8,184 jobs located within New Ulm are filled by residents of New Ulm. Most of the census blocks are relatively dense. These are the traditional city blocks that make up almost all of the city. The large yellow blocks on the western side of the city are newer developments that are the only traces of “suburbia”. They are also less dense likely because those blocks are also where the hospital and college grounds are located.

What becomes clear in this analysis is that the ideas of urbanism is not metro vs greater MN. Instead it is about a land use that works better for people and communities.

Palmisano should budget by our values

15 Dec

We all love living in Southwest Minneapolis. We love the strong sense of community that means three conversations while waiting for the concert to start at the band shell. We also love the high quality schools that produces top notch students and top notch theater.

We also love living in a progressive city that lives its values. It is why we elected Betsy on a platform of One Minneapolis. Which leads us to the city budget.

Councilwoman Palmisano has been put in what looks like a bind. She ran on a platform of stabilizing property taxes. Middle class and fixed income residents of her (our) district are asking her to help them stay in their homes and age in place by keeping property taxes in check; they have gone up because of million dollar homes and increases in the property tax levy. On the other hand she was elected in a wave of elections by city residents demanding serious action and investment towards ending the racial and economic injustices that hold back our city and all of its residents.

How does she best respond?

Councilwoman Palmisano should guide her decision on what we love about our neighborhood. She should channel our neighborliness and desire to stay here forever to advocate for a reallocation of senior housing investments towards Ward 13 so more seniors have the dignity to age in the city they love. She should channel our pride in our schools and teachers to advocate for affordable family housing investments in Ward 13 so more families have the opportunity of great education. This is one way to prioritize equity and meet her constituent needs.

The budget is our values in actions. Let us make them real.

Elliot Altbaum

Midtown Corridor: A Grade Separated Central Corridor

17 Oct

The Midtown LRT/Streetcar has joined the growing number of high efficiency corridors planned for the Minneapolis, St. Paul metro area. The Midtown LRT/Streetcar will run on the Greenway rail trench from the planned SW Green line station at W Lake Street to the Lake St station on the Blue line. Though the transit in the greenway is being classified as a streetcar, the fewer stops and connections to both the Green and Blue line means that it will function more as a light rail. It will be paired with Bus Rapid Transit (BRT) on Lake Street that extends all the way to St. Paul. It will connect with some of the busiest north-south corridors: Green Line, Hennepin, Lynndale, Nicollet, Red Line BRT on 35W, Chicago Ave, and the Blue Line. This route would also serve some of the densest areas in the region. Outside of the two downtowns, this is the east-west route with the most job and housing density.

Map: "Midtown's density will be key to it's sucess"

Because of the dual corridors of the Greenway and Lake Street, the route could be built in stages. BRT involves much less physical infrastructure and capital to develop so it could be built first. As funding becomes available, the LRT/streetcar can be built. After the Central Corridor, this is the next best rail investment that the region can make because it connects the densest housing in the state with job centers while also connecting neighborhood amenities.

This corridor has proven its viability through the high ridership of existing bus routes. This is an important future transit planning point. If we only build a train line every 8 years (6, if we’re hopeful), then each line must be done right to maximize our investment. Current ridership on existing local and express bus lines should be an indicator for which routes would most benefit from the expanded service or rail. Besides improved service, an expanded bus system generates insightful rider information, further honing long range transit planning.

The Midtown corridor has proven itself as a successful bus route that merits additional investment. it is included on the Met Council’s 2040 transit plan, the TPP. Let’s make sure that this corridor receives more attention and moves up the list of planned routes.

Sharing Like a Capitalist

15 Oct

The sharing economy has received lots of media adoration over the last couple of years. A closer look reveals a more troubling truth. There are various types of companies in this new economy, but the ride-sharing companies like Uber and Lyft provide a useful example. In a recent article, Avi Asher-Schapiro details the effects of this model on the workers.

Uber entered cities with great fanfare. They said that they had a ridesharing system that would be cheaper for the consumer and better for the drivers. At the beginning, Uber charged costumers a fare of $2.75 per mile (with an additional 60 cents per minute under eleven mph). With drivers keeping 80 percent of the fare, it was possible to work full time and make a $15-$20 an hour. This is what prompted the media to declare ride-sharing a success; workers were making a living wage and it was cheaper for the riders. This did not last.

Within the last year, rates have been cut to less than half of the earlier ones. With the drivers having no control over the fare price, Uber slashed rates to $1.10 per mile, plus 21 cents a minute. This has left the drivers with significantly less cash for the same amount of work. Now drivers struggle to barely make minimum wage.

Drivers are fighting back. Working with Teamsters locals, the drivers have started their own drivers associations. Because Uber treats each driver as a “partner-driver” the drivers are independent contractors. This makes forging unity among the workers more difficult. Nonetheless, strikes and protests have happened in Los Angeles, Seattle, New York City, and others. It is not going to be easy; Uber has raised $1.5 billion from tech investors in Silicon Valley and they want to make a lot of money.

Asher-Schapiro’s conclusion of the new sharing economy is damning:

[U]nder the guise of innovation and progress, companies are stripping away worker protections, pushing down wages, and flouting government regulations. At its core, the sharing economy is a scheme to shift risk from companies to workers, discourage labor organizing, and ensure that capitalists can reap huge profits with low fixed costs.
There’s nothing innovative or new about this business model. Uber is just capitalism, in its most naked form.

New technology and the economies it creates can be a force for bettering people’s lives. As progressives we need to raise our voice to ensure that it works for everyone.


This post first appeared a MN2020

Food and Education Go Hand in Hand

13 Oct

School Nutrition Association has increased its lobbying efforts to turn back new nutritional standards. In 2010 new legislation was passed that limited sodium and increased fruits and vegetables in school lunches. These regulations were passed with bipartisan support, but have since come under attack by the SNA by creating “opt-out” options for school districts. Their “concern” being that the new regulations will raise the price of producing school lunches thus putting additional strain in the districts. Right here in Minnesota we have a great example of how to create healthier meals that taste great.

Bertrand Weber is the Director of Nutrition and Culinary Services for the Minneapolis Public Schools. After seeing how school food exacerbated his son’s type 1 diabetes, Weber transitioned from cooking at high end restaurants and hotels to managing culinary services for school districts. When he started his position at MPS, he signaled big things would be changing. Many schools now have salad bars and school kitchens are being renovated so food can be cooked on site again. Students like the changes. Participation in the school lunch program has risen from 58 to 66 percent in just 2 years. Weber’s success shows that schools can find creative ways to provide high quality food that meets the new standards.

Weber also shifted district food purchasing policy to buy more local fruits and vegetables.

This is part of a larger movement by anchor institutions to use their purchasing power to shift large markets. The Real Food Challenge is a national student led movement to shift 20% of the $5 billion higher education spends on food each year. The Real Food Challenge lobbies universities to commit at least 20% of their food purchasing power to community supported, sustainable, and justly produced food. This May, the California State University committed their entire system to 20% real food by 2020. With 447,000 students and a $100 million food budget, they are the largest signatory of the Real Food Challenge. The $20 million that will be shifted each year will support the local food economy, improve wages on tomato farms and coffee plantations, and improve the health of our ecosystems.

Minnesota educational institutions should sign the Real Food Challenge Commitment. The University of Minnesota has special commitments to agriculture through its status as a land grant university. It could support more just and sustainable food for its enrolled 69,000 students. MNSCU serves 430,000 students. Changing its food purchasing policy would have a similar impact as it has in California. The Minnesota public schools serve 845,177 students each year. A significant change in purchasing policy at public schools would have the largest impact of all.  Let’s make Real Food possible for all Minnesotans by having our public institutions lead the way.


This post was first published at MN2020

The Bank for Better Buses, Part 3

10 Oct

Creating a full-service Metro Go-To Card would benefit transit usersand those without access to traditional banking services. It would also benefit the Met Council. There are examples of public institutions acting as lending agencies that provide great benefit to a range of people. The largest example of a public institution bank is the Bank of North Dakota (BND).

In 1919, North Dakotans, in a wave of populist progressivism and angry at the financial control wielded by Twin Cities’ banks, created a publicly operated bank that could provide loans and hold savings. Created by and for the people, BND was designed to provide more affordable loans to struggling farmers and families out on the prairie. Over the last 80 years it has provided a tremendous service to the state of North Dakota and continues to receive large support for citizens.

Banks make money by charging a higher interest rate on loans than needed to pay the smaller interest rate of depositors. As a private institution they seek to maximize these profits. Banks can make small loans to farmers that need new equipment or to governments that need new infrastructure, making money on each of them. North Dakota found that a public bank worked better for them.

As a public institution, BND has a different objective, to provide a quality service to its citizens. Instead of profits being placed in the hands of bankers, they are returned, in various ways, to the people of North Dakota. Mostly profits are returned through lower interest rates. Farmers and students can better escape the stress of high levels of debt that plague them both. It can also provide low interest rate loans to the cities and state of North Dakota. Studies have shown that interest from private loans composes 30-50 percent of public loans. Without needing to pay back expensive interest to private banks, cities can build better schools and the state can build sewers more affordably. This makes North Dakota a better place to live.

The Met Council can learn from the success of the Bank of North Dakota by creating a bank that could provide loans for infrastructure improvements. The Met Council has recently invested in the water and sewer system so these will need little large investments in the coming decades (Thrive 2040). The Met Council and the region do recognize that we need to significantly invest in transportation infrastructure for the next couple of decades. These projects would benefit from the assistance of a public bank. I want a bank that begets better buses. Don’t you?


This post first appeared on MN2020

Go-To Banking, Part 2

8 Oct

The expanding list of transportation options makes our multi-modal system stronger. All of these services should be lauded for its efforts. There is one catch, however. Each transportation service requires a debit or credit card as a payment option. For the 16.7 percent of Minnesotans who are unbanked or underbanked, debit and credit cards are out of reach.

The FDIC classifies unbanked as those people lacking any kind of deposit account at an insured depository institution such as a savings or checking account. Underbanked housholds have a bank account but also rely on Alternative Financial Services (AFS) like money orders, non-bank check cashing, payday loans, and prepaid debit cards. Each of these services exacts heavy fees, making these services more expensive than traditional banking.

While 16.7 percent of unbanked or underbanked households is too many people with too few options, it is the lowest percentage in the Upper Midwest (Wisconsin is at 18.7 percent). However, like so many of the great successes in Minnesota, there is a large disparity in who shares in that success. Whereas 14.8 percent of family households (as compared to non-family households) were without full banking services, 36.5 percent of households led by a single female were without full banking services. Of those making under $15,000 a year, 58.5 percent were fully banked. Only 39.5 percent of black households were fully banked, compared to 84.7 percent of white households. This is consistant with national disparities where 41.6 percent of black households are fully banked compared to 77 percent of white households. People across the county are working on different ways to give everyone access to banking options.

Chicago has come up with one solution to help those without banking services while serving its transportation mission. The Chicago Transit Authority (CTA) has switched to a new fare payment system called Ventra. Ventra operates similar to the Twin Cities’ Metro Transit Go-To card in that a person can buy long term passes and store funds. Its additional feature makes it different. The Ventra card also functions as a prepaid debit card, usable anywhere debit cards are accepted. This may seem like a large jump but in fact is just a continuation of previous services.

The fare cards preceding Ventra, Chicago Card and Go-To, also stored money for later use. The transit service restricted transactions to their proprietary transportation services but the principle of a financial exchange instrument is the same. Eliminating the payment restriction allows people to save money in their transit account just as they would in a traditional bank account. This change would allow those without banking access to the services traditionally accessed though bank accounts.

The transition in Chicago has been controversial, however. The CTA outsourced fare collection and the prepaid debit card system to the private company Ventra rather than keep it agency managed like the Chicago Card. The outsourcing has led to price increases similar to what was experienced when Chicago sold all city parking meters to investment firms. When Ventra took over fare collection for the CTA, single fare tickets increased from $2.25 to $3.00. The one-day pass jumped from $5.75 to $10, a 74% increase. The prepaid debit card is similarly riddled with high costs and hidden fees. Though it is free to activate, Walletnerd.com estimates using the card will cost $188 per year. This is more expensive than most other prepaid debit cards. This is a good reminder that outsourcing government isn’t better for citizens. It might look cheaper on paper, but only because costs are externalized, especially to those already struggling.

Minnesota can improve on Chicago by implementing the system though the Go-To card. Met Transit would expand the functionality of Go-To cards by letting them act as savings accounts. Public oversight from the Met Council would prevent the price gouging seen in Chicago, giving everyone the opportunity for affordable transactional instruments, creating more options for the unbanked and underbanked.

(Banking data from the FDIC 2011 National Survey of Unbanked and Underbanked Households)


This post first appeared at MN2020